7 Multi-Touch Attribution Models Every Conversion-Focused Marketer Should Know
The end goal of any business — online, offline, or both — is to generate revenue and grow it over time. Much of that responsibility falls on marketers, who operate across three primary stages: building awareness, nurturing consideration, and nudging potential customers toward a decision through offers, trials, or other incentives.
To move prospects through those stages, online marketers typically deploy a mix of channels:
- Social media advertising (Facebook, Twitter, LinkedIn, etc.)
- Search engine optimization (SEO)
- Paid search
- Email marketing
The challenge emerges once those channels are running in parallel: which ones are actually driving conversions?
That's the problem attribution is designed to solve.
Attribution is the process of assigning credit to one or more consumer interactions — called touchpoints — that occur across a customer journey (also called a conversion path) before a conversion takes place. A conversion is any goal a marketer defines: a purchase, a file download, a form submission, or similar actions. Attribution lets marketers understand how each channel contributes to the final outcome.
There are several multi-touch attribution models that approach this problem differently. Each one distributes conversion credit across touchpoints according to its own logic, with its own assumptions about which interactions matter most. Understanding how they work mechanically is essential to choosing the right one — or building a better one.
1. Last Interaction Attribution

The last interaction model (also called the last click model) is one of the oldest attribution approaches and remains the default in many web analytics platforms.
The logic is straightforward: 100% of conversion credit goes to the final known referral, click, or traffic source immediately before the conversion. If the last action before a purchase was a direct visit to the site, that direct visit receives all the credit — regardless of what came before it.
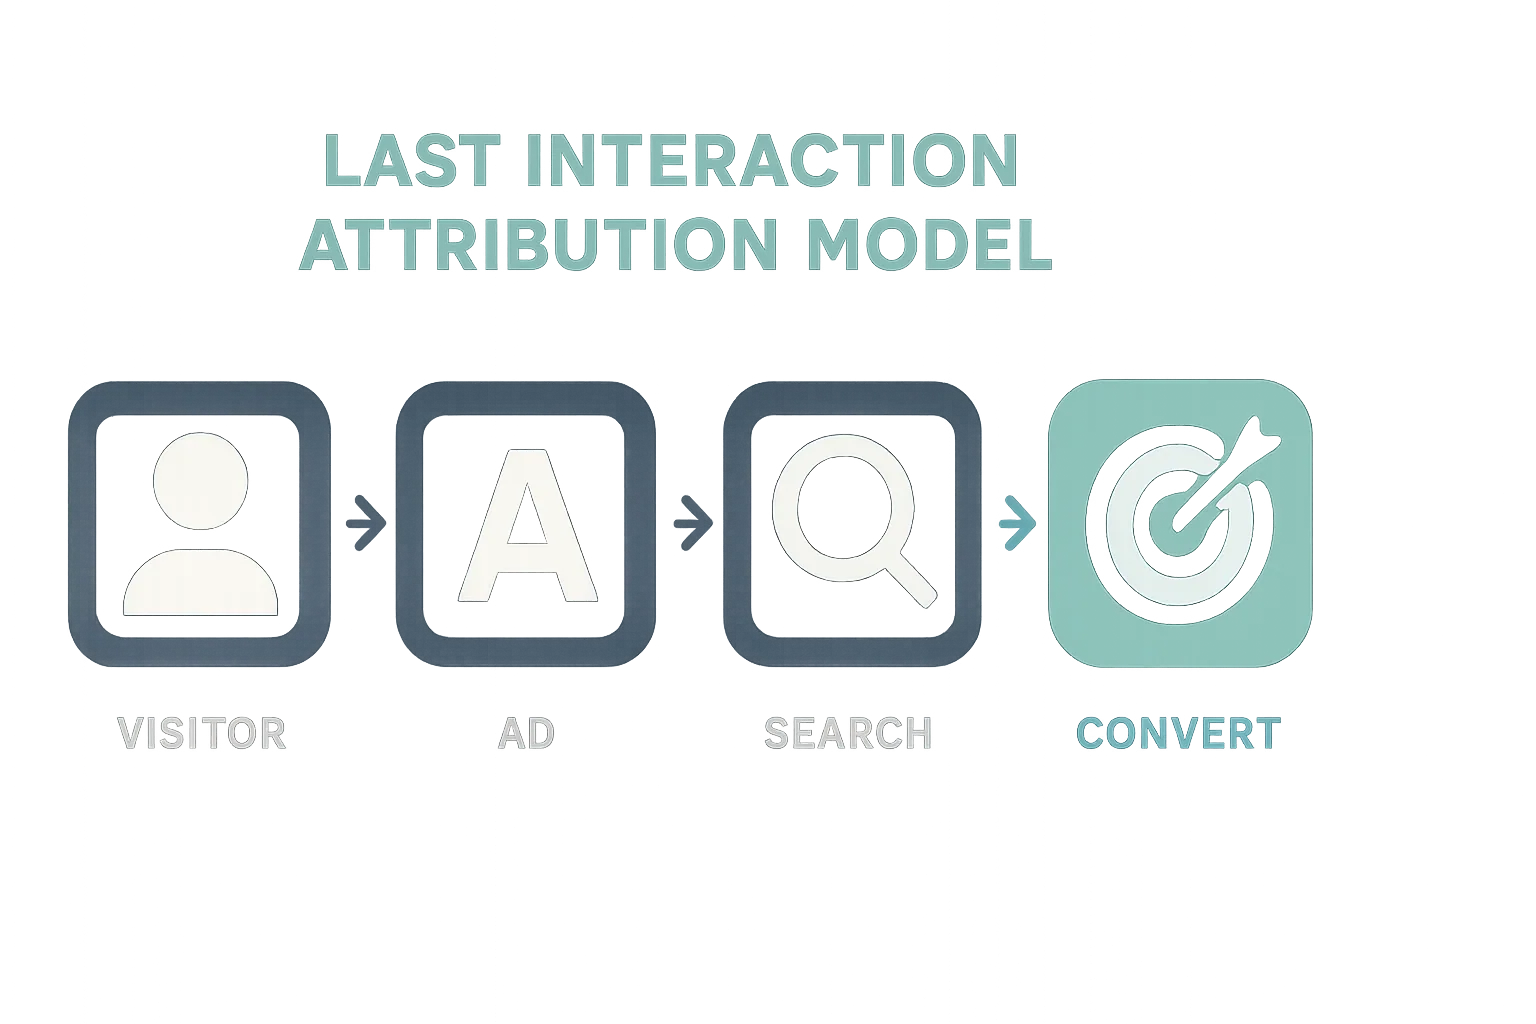
The obvious limitation is that this model ignores every prior touchpoint in the customer journey. In a multi-channel environment, that's rarely an accurate picture, and decisions made on this data alone can be significantly misleading.
2. Last Non-Direct Attribution
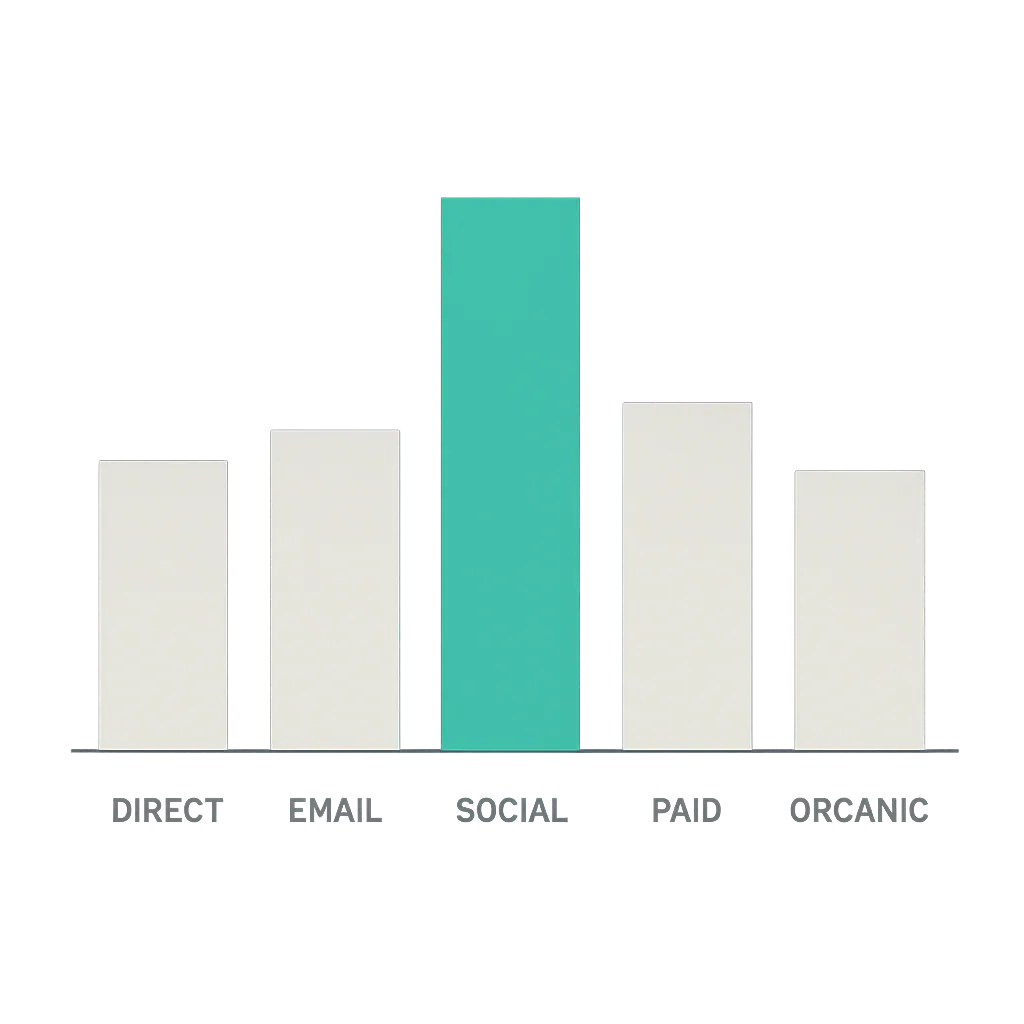
The last non-direct model is a close relative of the last interaction model, with one meaningful adjustment: direct visits are excluded from credit assignment entirely.
In this model, 100% of conversion credit goes to the last known click or referral that was not a direct visit. For example, if a consumer first arrived via Facebook, then returned through a direct visit and converted, Facebook receives 100% of the credit. The direct visit is treated as irrelevant to the attribution calculation.
steps-2-2 The Last Non-Direct Attribution Model example
This model is a marginal improvement over pure last-click attribution — it filters out some noise — but it still oversimplifies the multi-channel journey. Like the last interaction model, it disregards all earlier touchpoints and can produce false insights if relied upon too heavily.
3. First Interaction Attribution
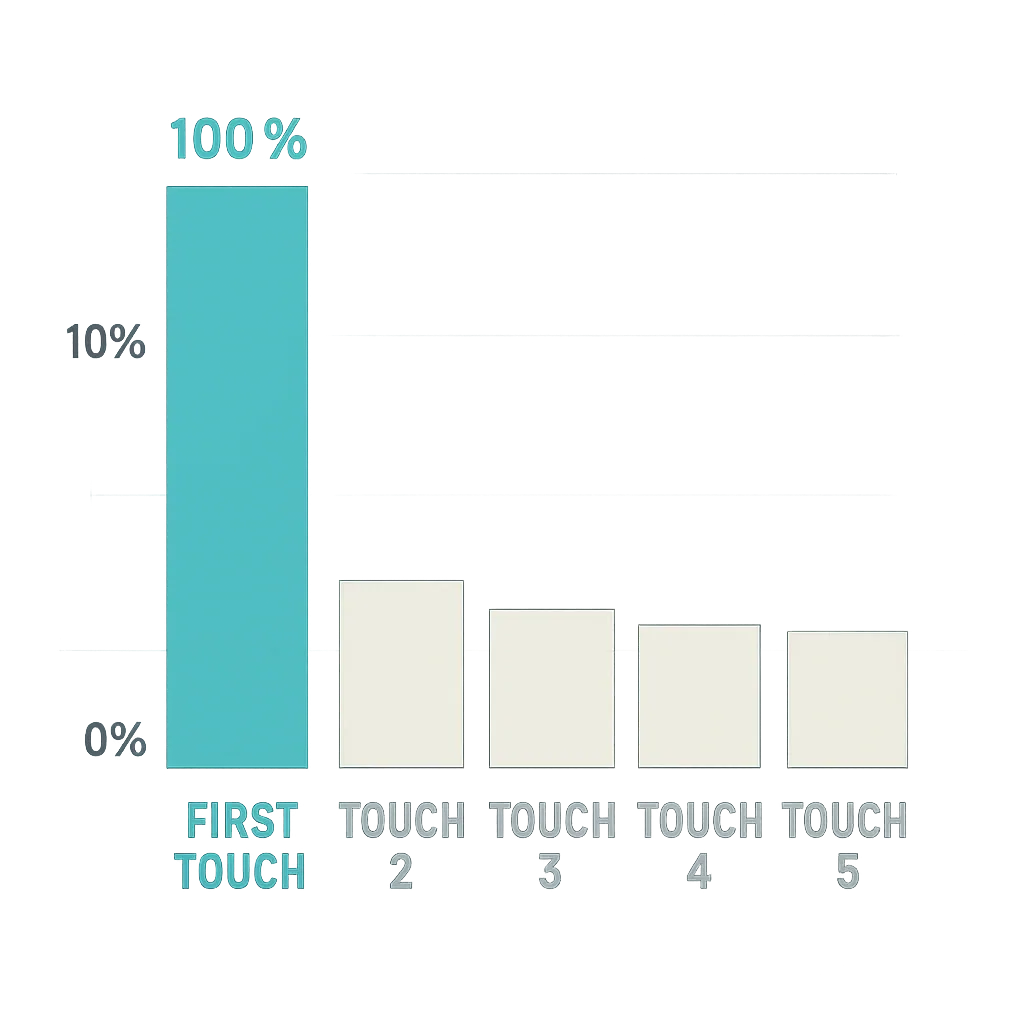
The first interaction model (or first touch model) is the mirror image of the last interaction approach. Here, 100% of the conversion credit goes to the very first registered referral or click in the customer journey.

Consider a consumer who first discovered a brand through a Google Ads ad, then returned via organic search, then via a direct visit, and finally converted. Under first interaction attribution, the Google Ads click receives the full 100% credit.
This model has genuine utility when the primary marketing objective is brand awareness — understanding which channels are introducing the brand to new audiences for the first time. It becomes a poor fit in most other scenarios, since it completely ignores every subsequent touchpoint that may have done the actual work of converting a prospect.
4. Linear Attribution
graph-all-small The Linear Attribution Model
The linear attribution model is the first of the seven to acknowledge the full shape of the customer journey. Rather than concentrating credit on a single touchpoint, it distributes credit equally across all touchpoints in the conversion path.
If a customer arrived via a Google Ads ad, then through organic search (SEO), then through a direct visit before converting, each channel receives 33% of the credit — an equal share across the three touchpoints.
steps-4 The Linear Attribution Model example
This model is useful when a marketer wants a comprehensive view of the conversion path and has reason to believe each touchpoint contributes roughly equal value. In practice, that assumption rarely holds. Not all interactions carry the same weight — some touchpoints move the needle far more than others — and treating them identically can lead to misallocation of budget and effort just as easily as the single-touch models do.
5. Time Decay Attribution
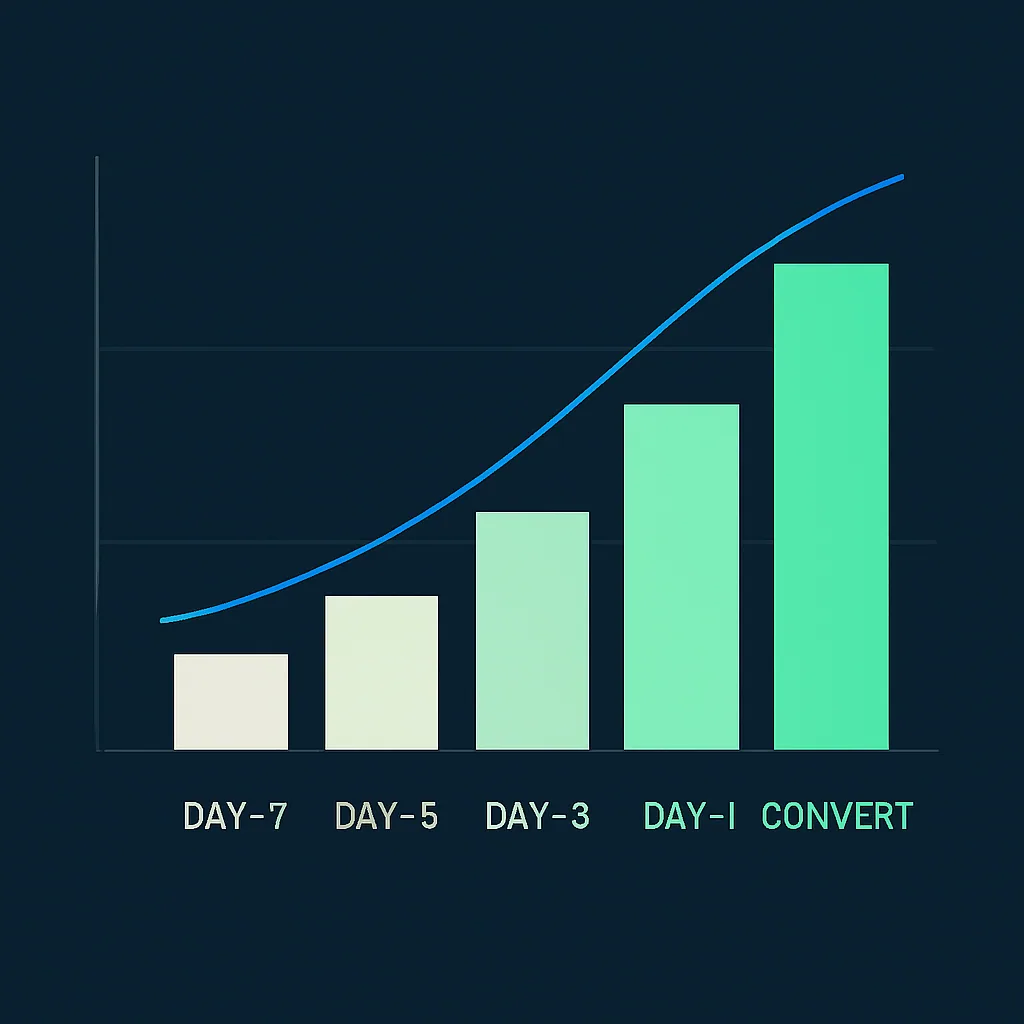
The time decay model is a refinement of the linear approach. It captures the full customer journey but introduces a simple weighting algorithm: the closer a touchpoint is in time to the conversion, the more credit it receives. The further a touchpoint sits from the moment of conversion, the more its credit "decays."
A practical illustration across a 7-day conversion window:
- 7 days before conversion — first visit via Facebook Ads
- 5 days before conversion — second visit via Google Ads
- 4 days before conversion — third visit via direct entry
- 2 days before conversion — fourth visit via organic Google search
- Same day as conversion — fifth visit via email
A possible credit distribution under the time decay model:
- 15% attributed to Facebook Ads
- 17% attributed to Google Ads
- 19% attributed to direct visit
- 23% attributed to Google organic search (SEO)
- 26% attributed to email marketing
The exact percentages will vary depending on how the model is configured in a given analytics platform and any customizations applied. The principle, however, is consistent: recency drives weight.
Time decay attribution is broadly well-suited for most marketing campaign reporting. It's particularly valuable for e-commerce brands and others focused on shortening conversion paths — getting prospects to convert sooner rather than later — since it naturally emphasizes the interactions that close the deal.
6. Position-Based Attribution
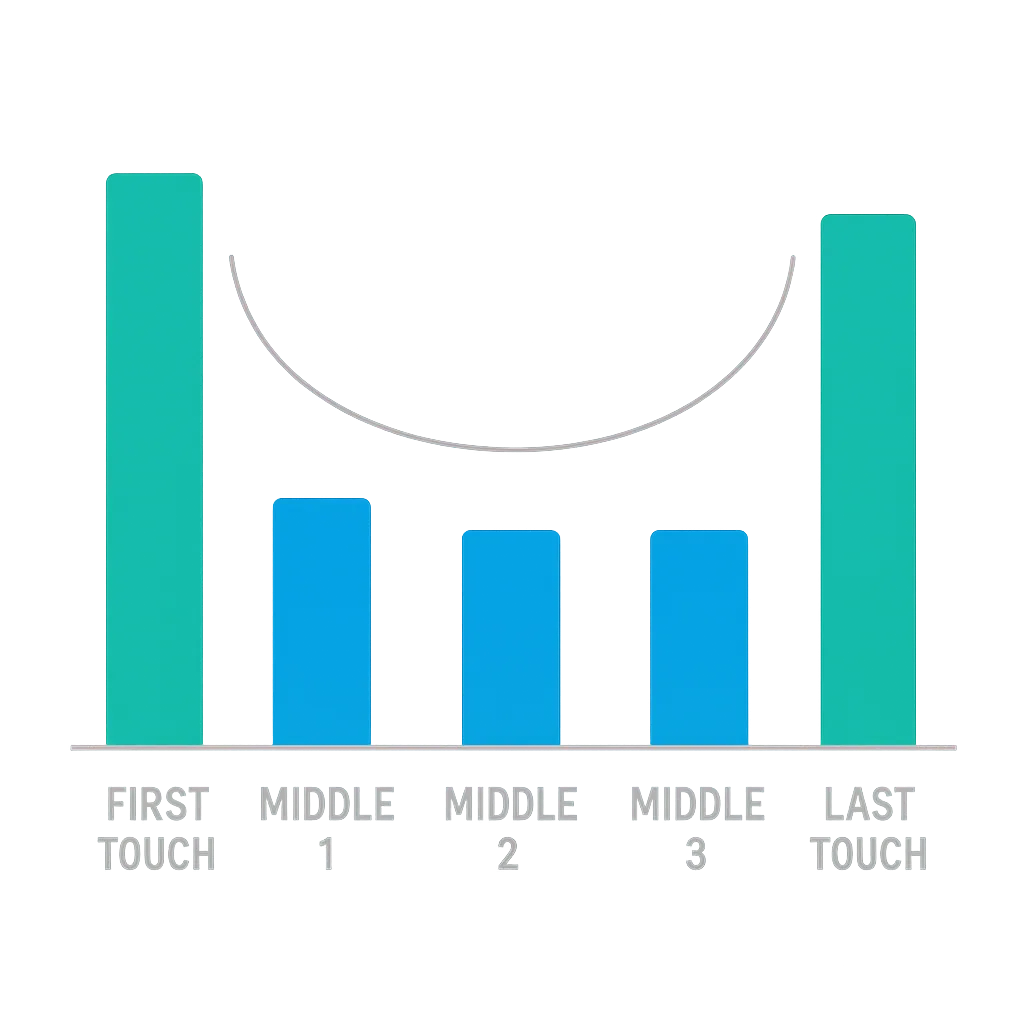
The position-based model (sometimes called the U-shaped model) assigns credit based on where each touchpoint falls within the conversion path rather than when it occurred. The underlying assumption is that the first touchpoint — which introduced the customer to the brand — and the last touchpoint — which immediately preceded the conversion — are the most important interactions. Everything in between plays a supporting role.
Using the same five-touchpoint example:
- First touchpoint: Facebook Ads
- Second touchpoint: Google Ads
- Third touchpoint: direct visit
- Fourth touchpoint: Google organic search
- Fifth touchpoint: email
Credit distribution under the position-based model:
- 40% attributed to Facebook Ads (first touchpoint)
- 6.7% attributed to Google Ads
- 6.7% attributed to direct visit
- 6.7% attributed to Google organic search
- 40% attributed to email marketing (last touchpoint)
steps-5 The Position Based Attribution Model example
Of the pre-built models covered here, position-based attribution tends to offer the most balanced view of the customer journey. It acknowledges both the discovery moment and the conversion trigger, while still assigning some value to the middle interactions. It's a reasonable starting point for marketers who are new to attribution modelling and want a model that reflects realistic customer behaviour without requiring custom development.
That said, it's not universally appropriate. Different industries and business models may require a different weighting logic, and this model won't capture those nuances on its own.
7. Custom Attribution
The custom attribution model is, by most measures, the most powerful option — and also the most demanding. Rather than applying a fixed formula, a custom model is built around the specifics of a particular marketing program: the channels in use, the customer data available, the brand's position in the market, and the shape of its actual conversion paths.
Pre-built models are a practical starting point, but custom attribution is where the real analytical value lies.
Critically, a custom model is never truly finished. Its value comes from ongoing iteration: forming hypotheses about what drives conversions, testing them against real data, and updating the model accordingly. A well-designed custom model will account for:
- The position of each touchpoint in the customer journey
- User engagement signals on the site
- Journey length
- Whether brand search queries appear in the touchpoint sequence
- Any other factors specific to the business and its audience
The investment required to build and maintain a custom model is higher, but so is the quality of the insights it produces. For marketers serious about understanding conversion causality — not just correlation — it's the direction worth moving toward.
Choosing the Right Model
No single attribution model is the right answer for every situation. The simpler single-touch models (last interaction, last non-direct, first interaction) are easy to implement but systematically ignore large parts of the customer journey. The multi-touch models (linear, time decay, position-based) are more representative but carry their own assumptions about what matters.
The practical path forward is usually to start with a position-based or time decay model to gain baseline insight into the full conversion path, then invest in a custom model as the data and analytical maturity of the marketing operation grows. Whichever model is in use, it should be treated as a working hypothesis — tested, challenged, and refined continuously rather than set and forgotten.